Oil spills in Rivers. Part II: Oil Spill
This is the second part of the Oil spills in rivers tutorial. The first part explained how to setup and run the hydrodynamic stage, where the model was used to generate the velocity field in the river. In this section we will show how to enter the spill locations, and other oil data to simulate oil trajectories and fate.
Opening the project with results obtained in Part I
We will use the files resulting from Part I of the tutorial that should have been generated before in the 'OilSpillsInARiverPart1' folder under '\ExampleProjects\OilSpillsInARiverPart1'.
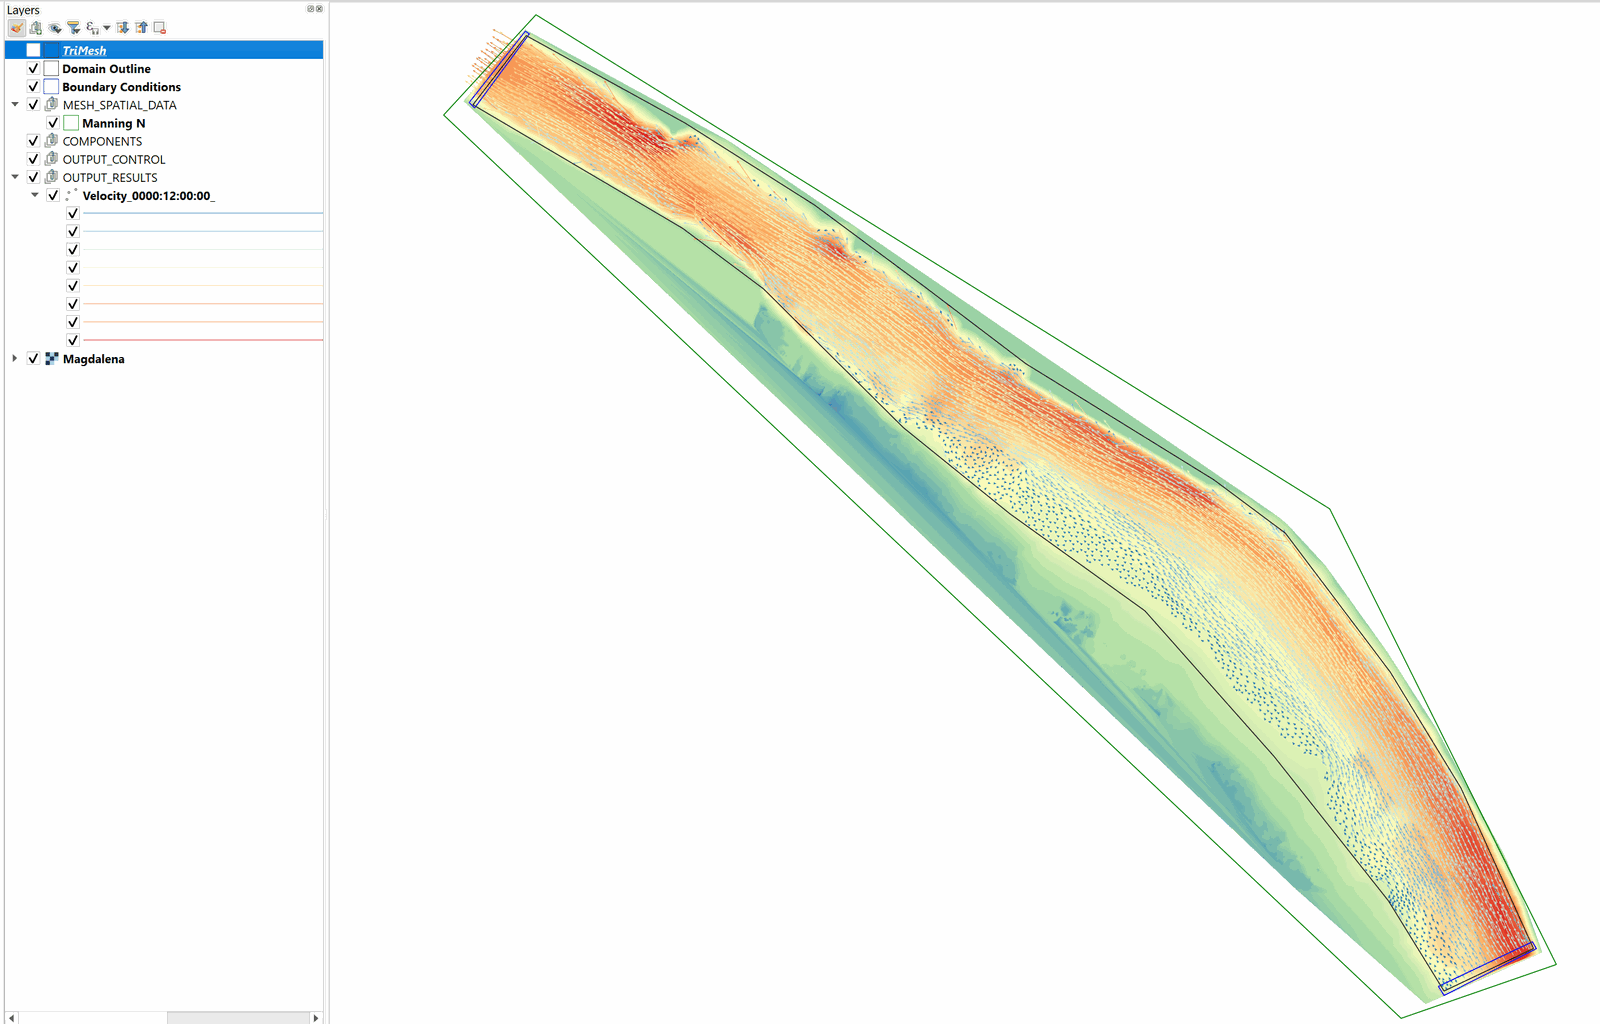
Open QGIS and then open the project resulting from Part I, where we completed the hydrodynamic simulation of the river and created a velocity field map:
Alternately you may choose to open a premade version of the Part I project located in the OilSpillsInARiverPart1Final folder.
Create the OilSpills layer and enter the spill location and data
-
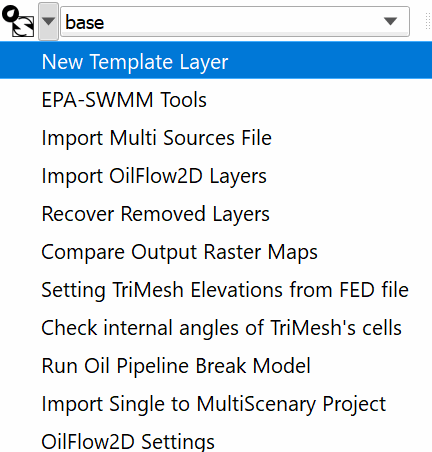
Create a new OilSpills layer: for this, go to the OilFlow2D toolbar of and click on New Template Layer
-
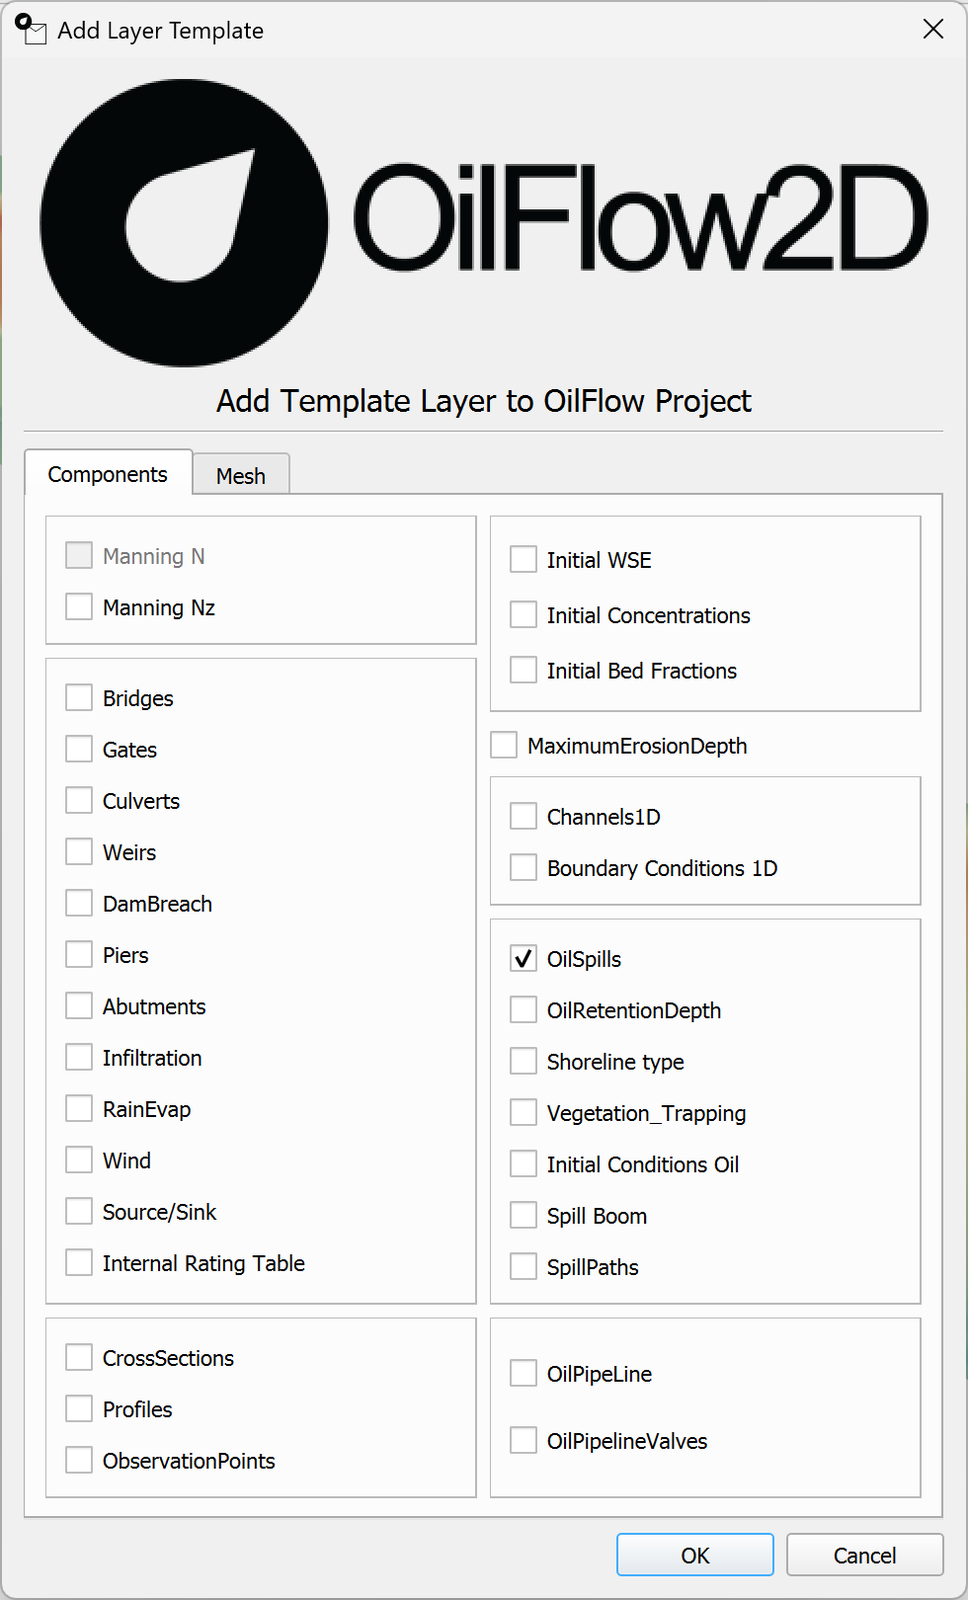
In the Add Template Layer dialog, select the OilSpills checkBox, as shown in the Figure below and click OK.
-
Edit the OilSpills layer: In the layers panel we select the OilSpills layer then in the digitalization toolbar we click on the Toggle Editing button

A pencil icon will appear in the OilSpills layer that tells us that the layer is in edit mode
 .
. -
To enter the spill location click on the Add Point Feature button of the digitalization toolbar
 and then click on the location where you want to set the spill point. The oil spill dialog will appear. Enter the data as indicated in the figure: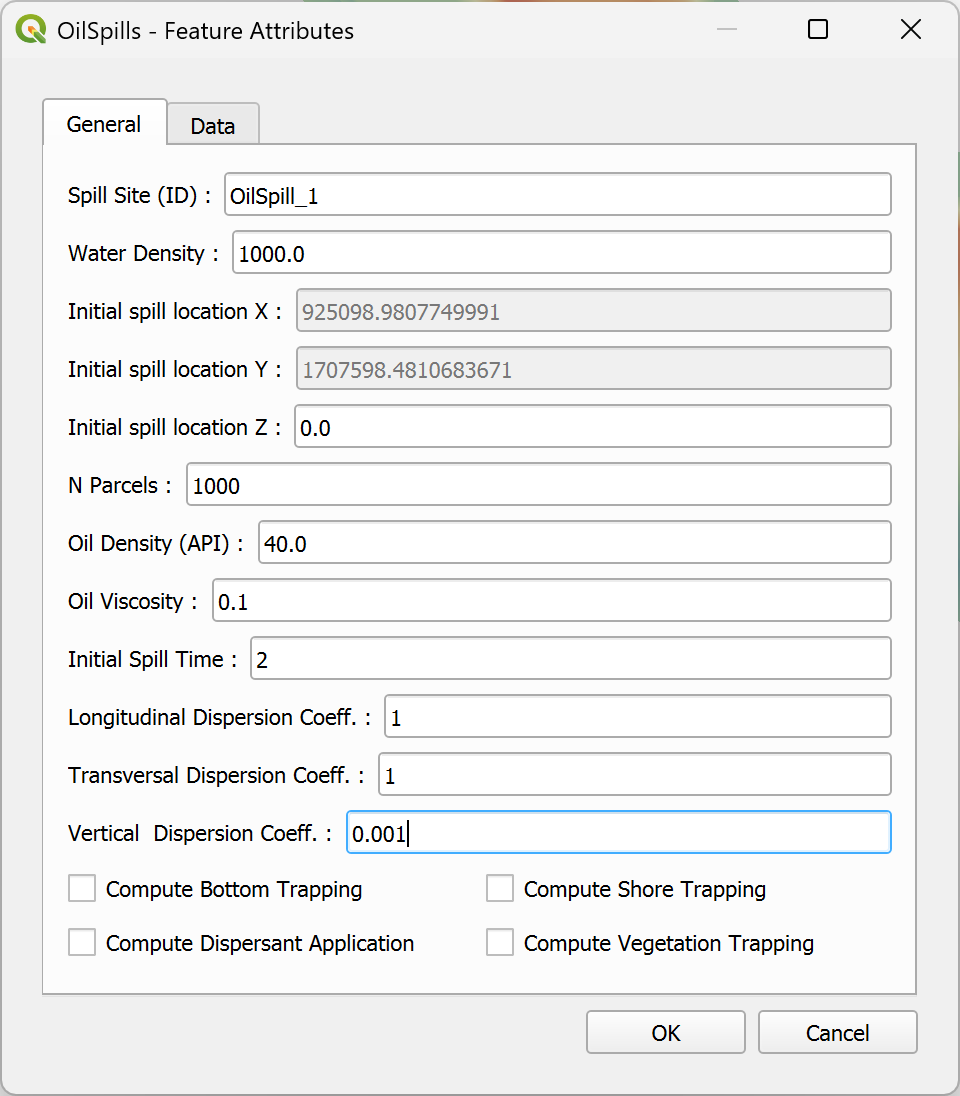
-
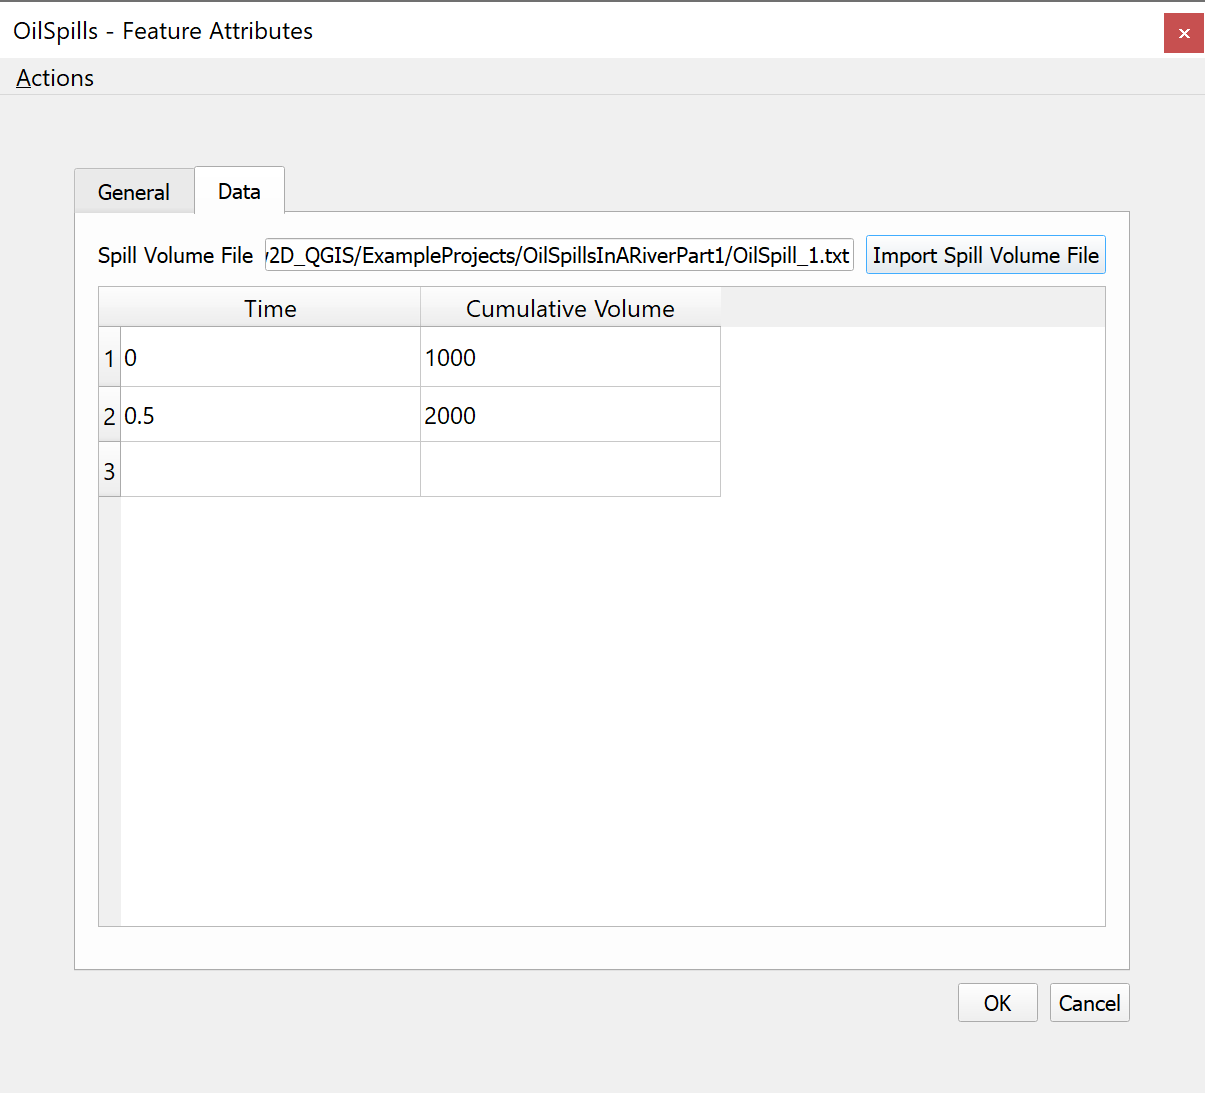
Click on the Data panel and open the spill volume file using the Import Spill Volume File button.
-
Browse to the project 'DATA' folder and select 'Oilspill_1.txt'.
-
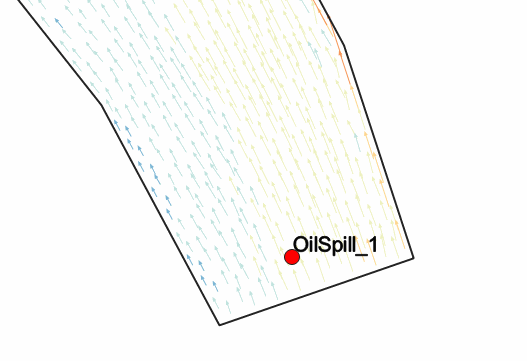
Click OK to close the dialog and the oil spill point will be shown:
-
Click on the Save Layer Edits button
 Toggle editing button then click the Toggle Editing to finalize the editing mode.
Export Oil Spill Data
-
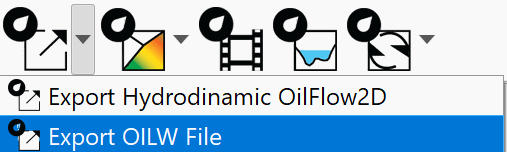
Use the Export OILW command to export the data to run the model
-
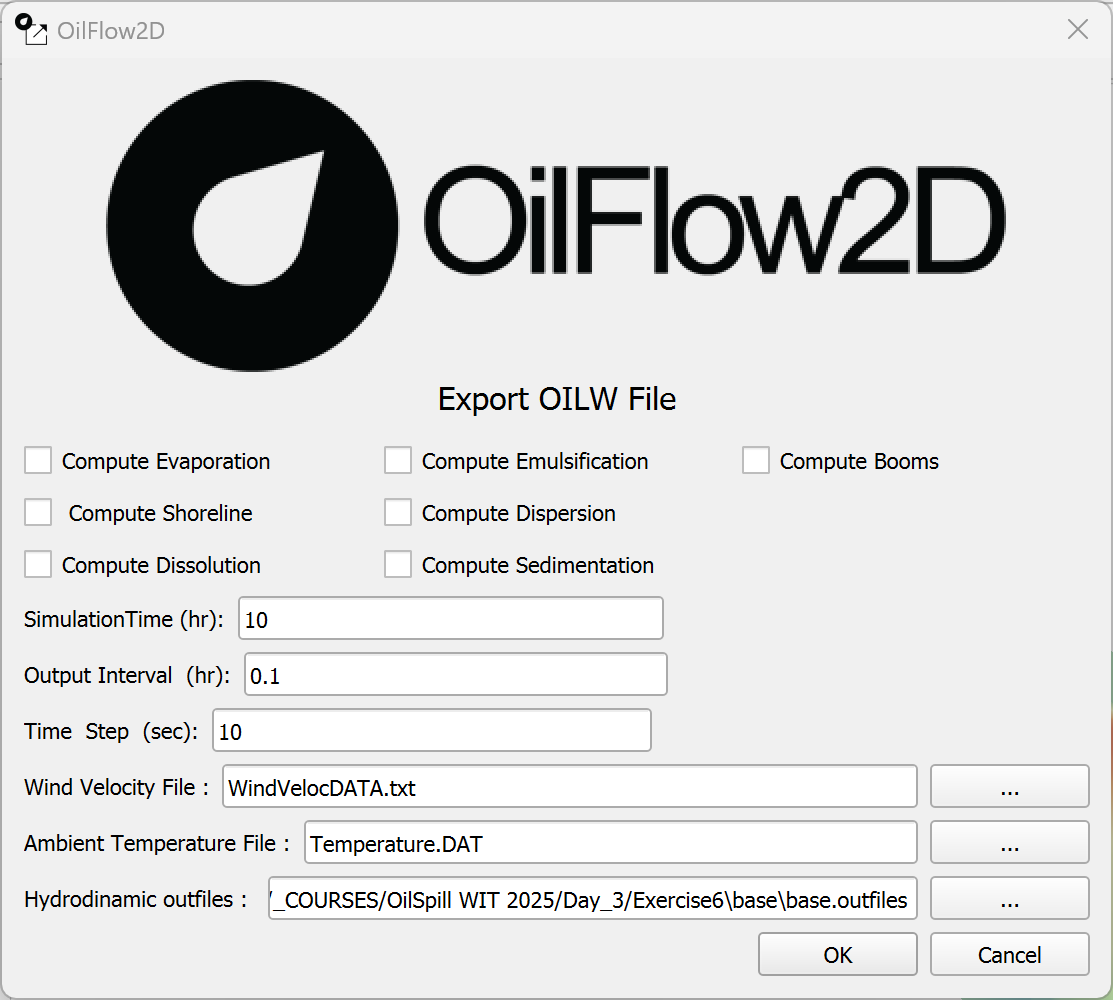
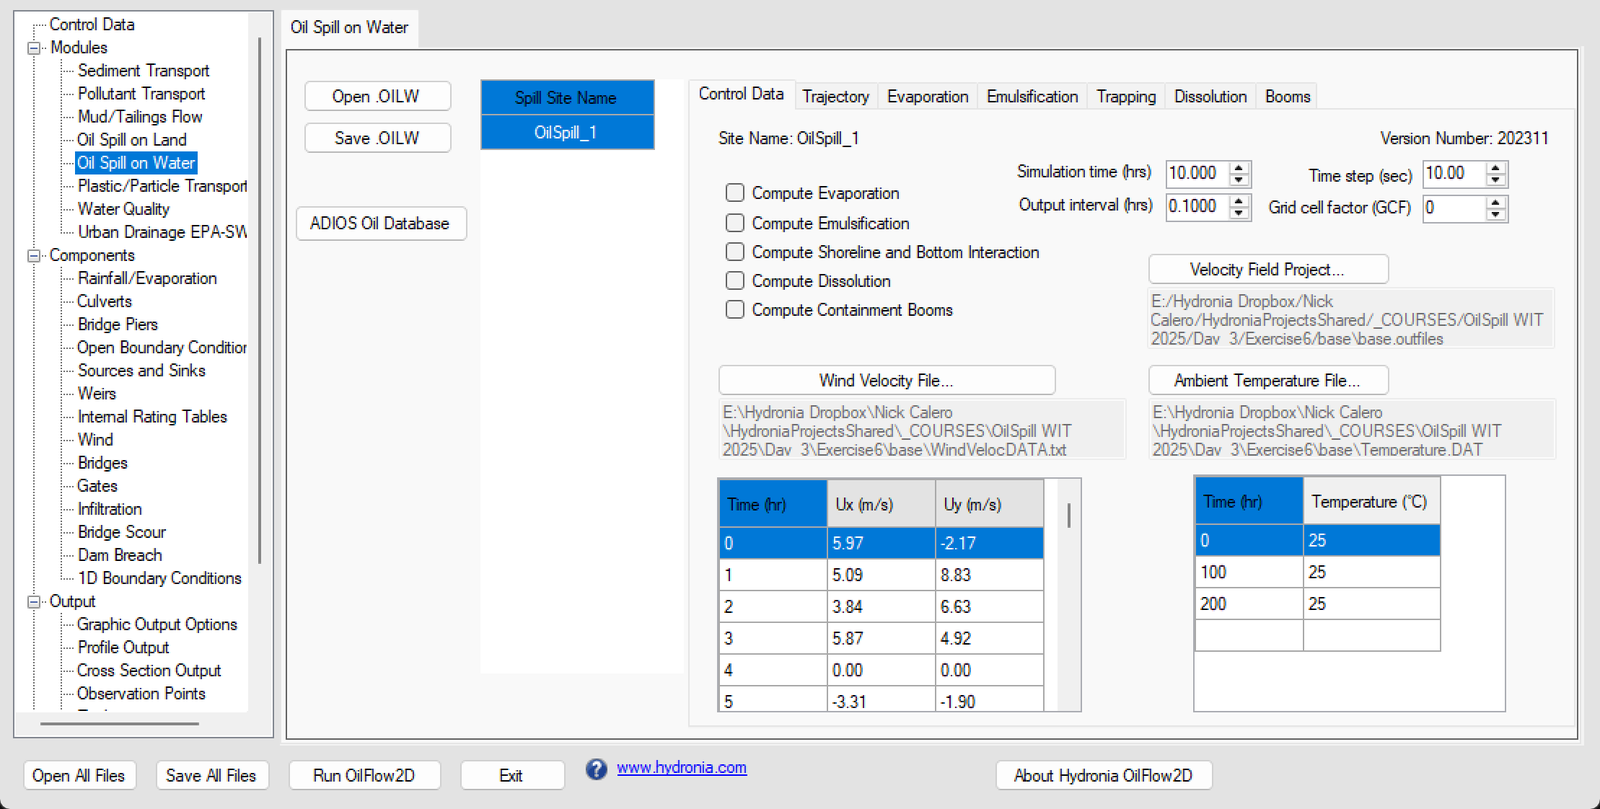
In the dialog enter the simulation time (12 h), output interval (0.5 h), the time step (10 sec.), import the wind velocity data ('WindVelocData.DAT') file, and ambient temperature file ('Temperature.DAT') as shown, and click OK.
After export completes, version 10 and later users see the
Open DIPdialog.QGIS DIPis selected by default; clickOKto open it inside QGIS. To use the historical standalone option, expandMore options, selectClassic DIP, and then clickOK.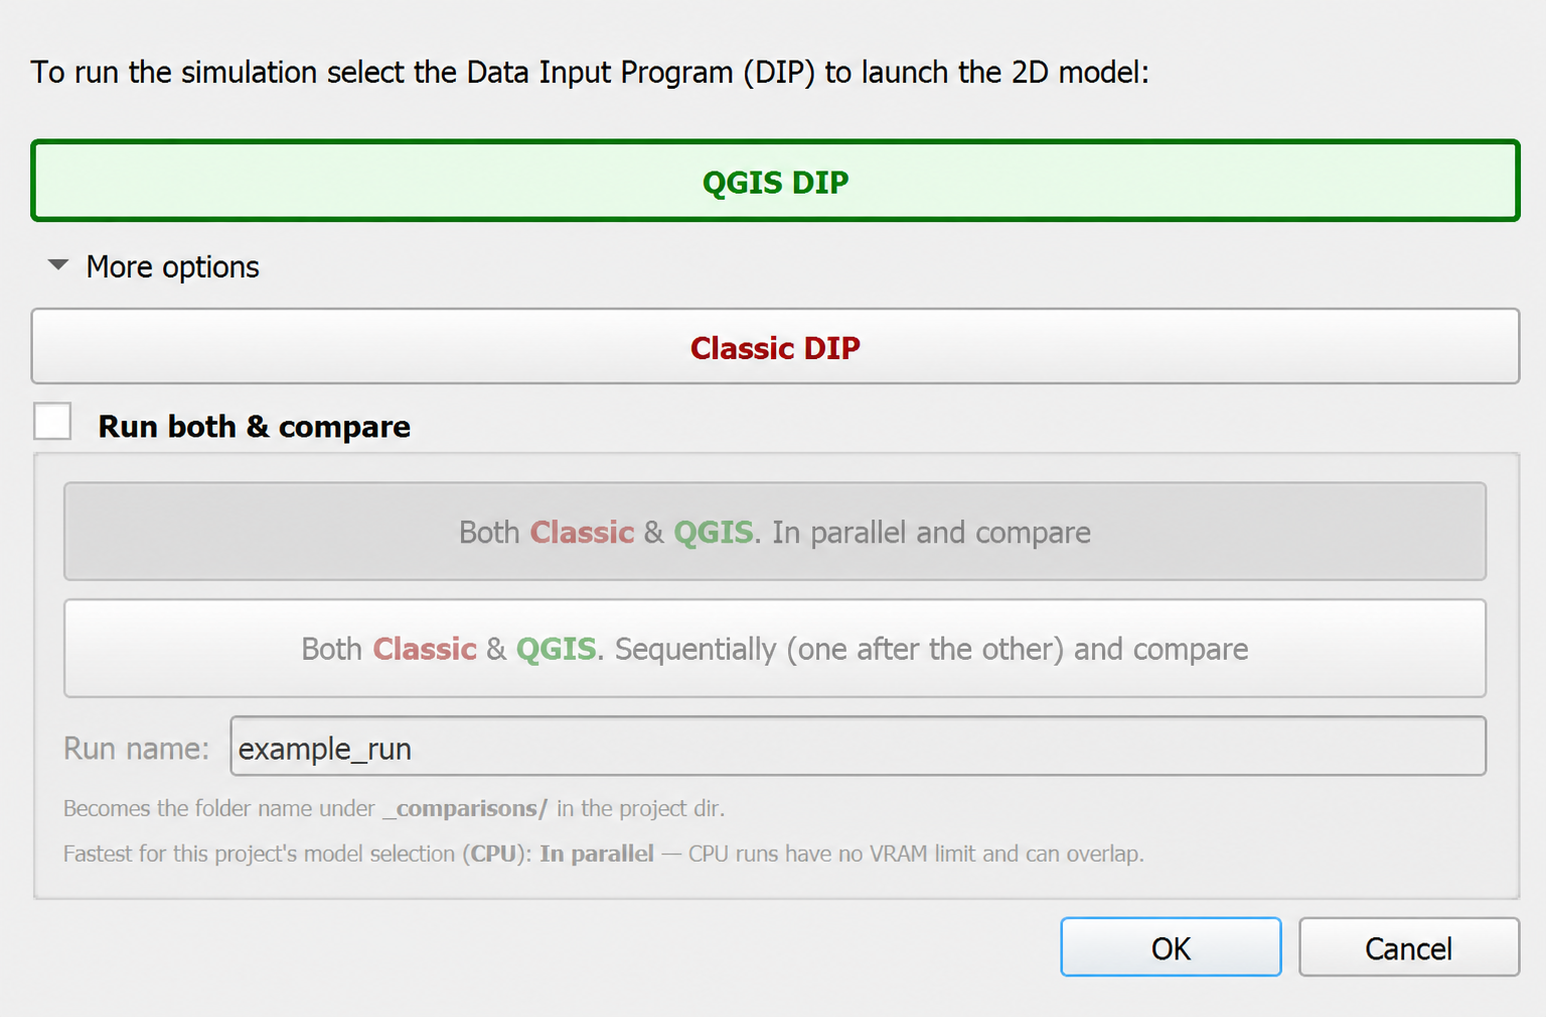
With
QGIS DIPselected, the current interface is shown below: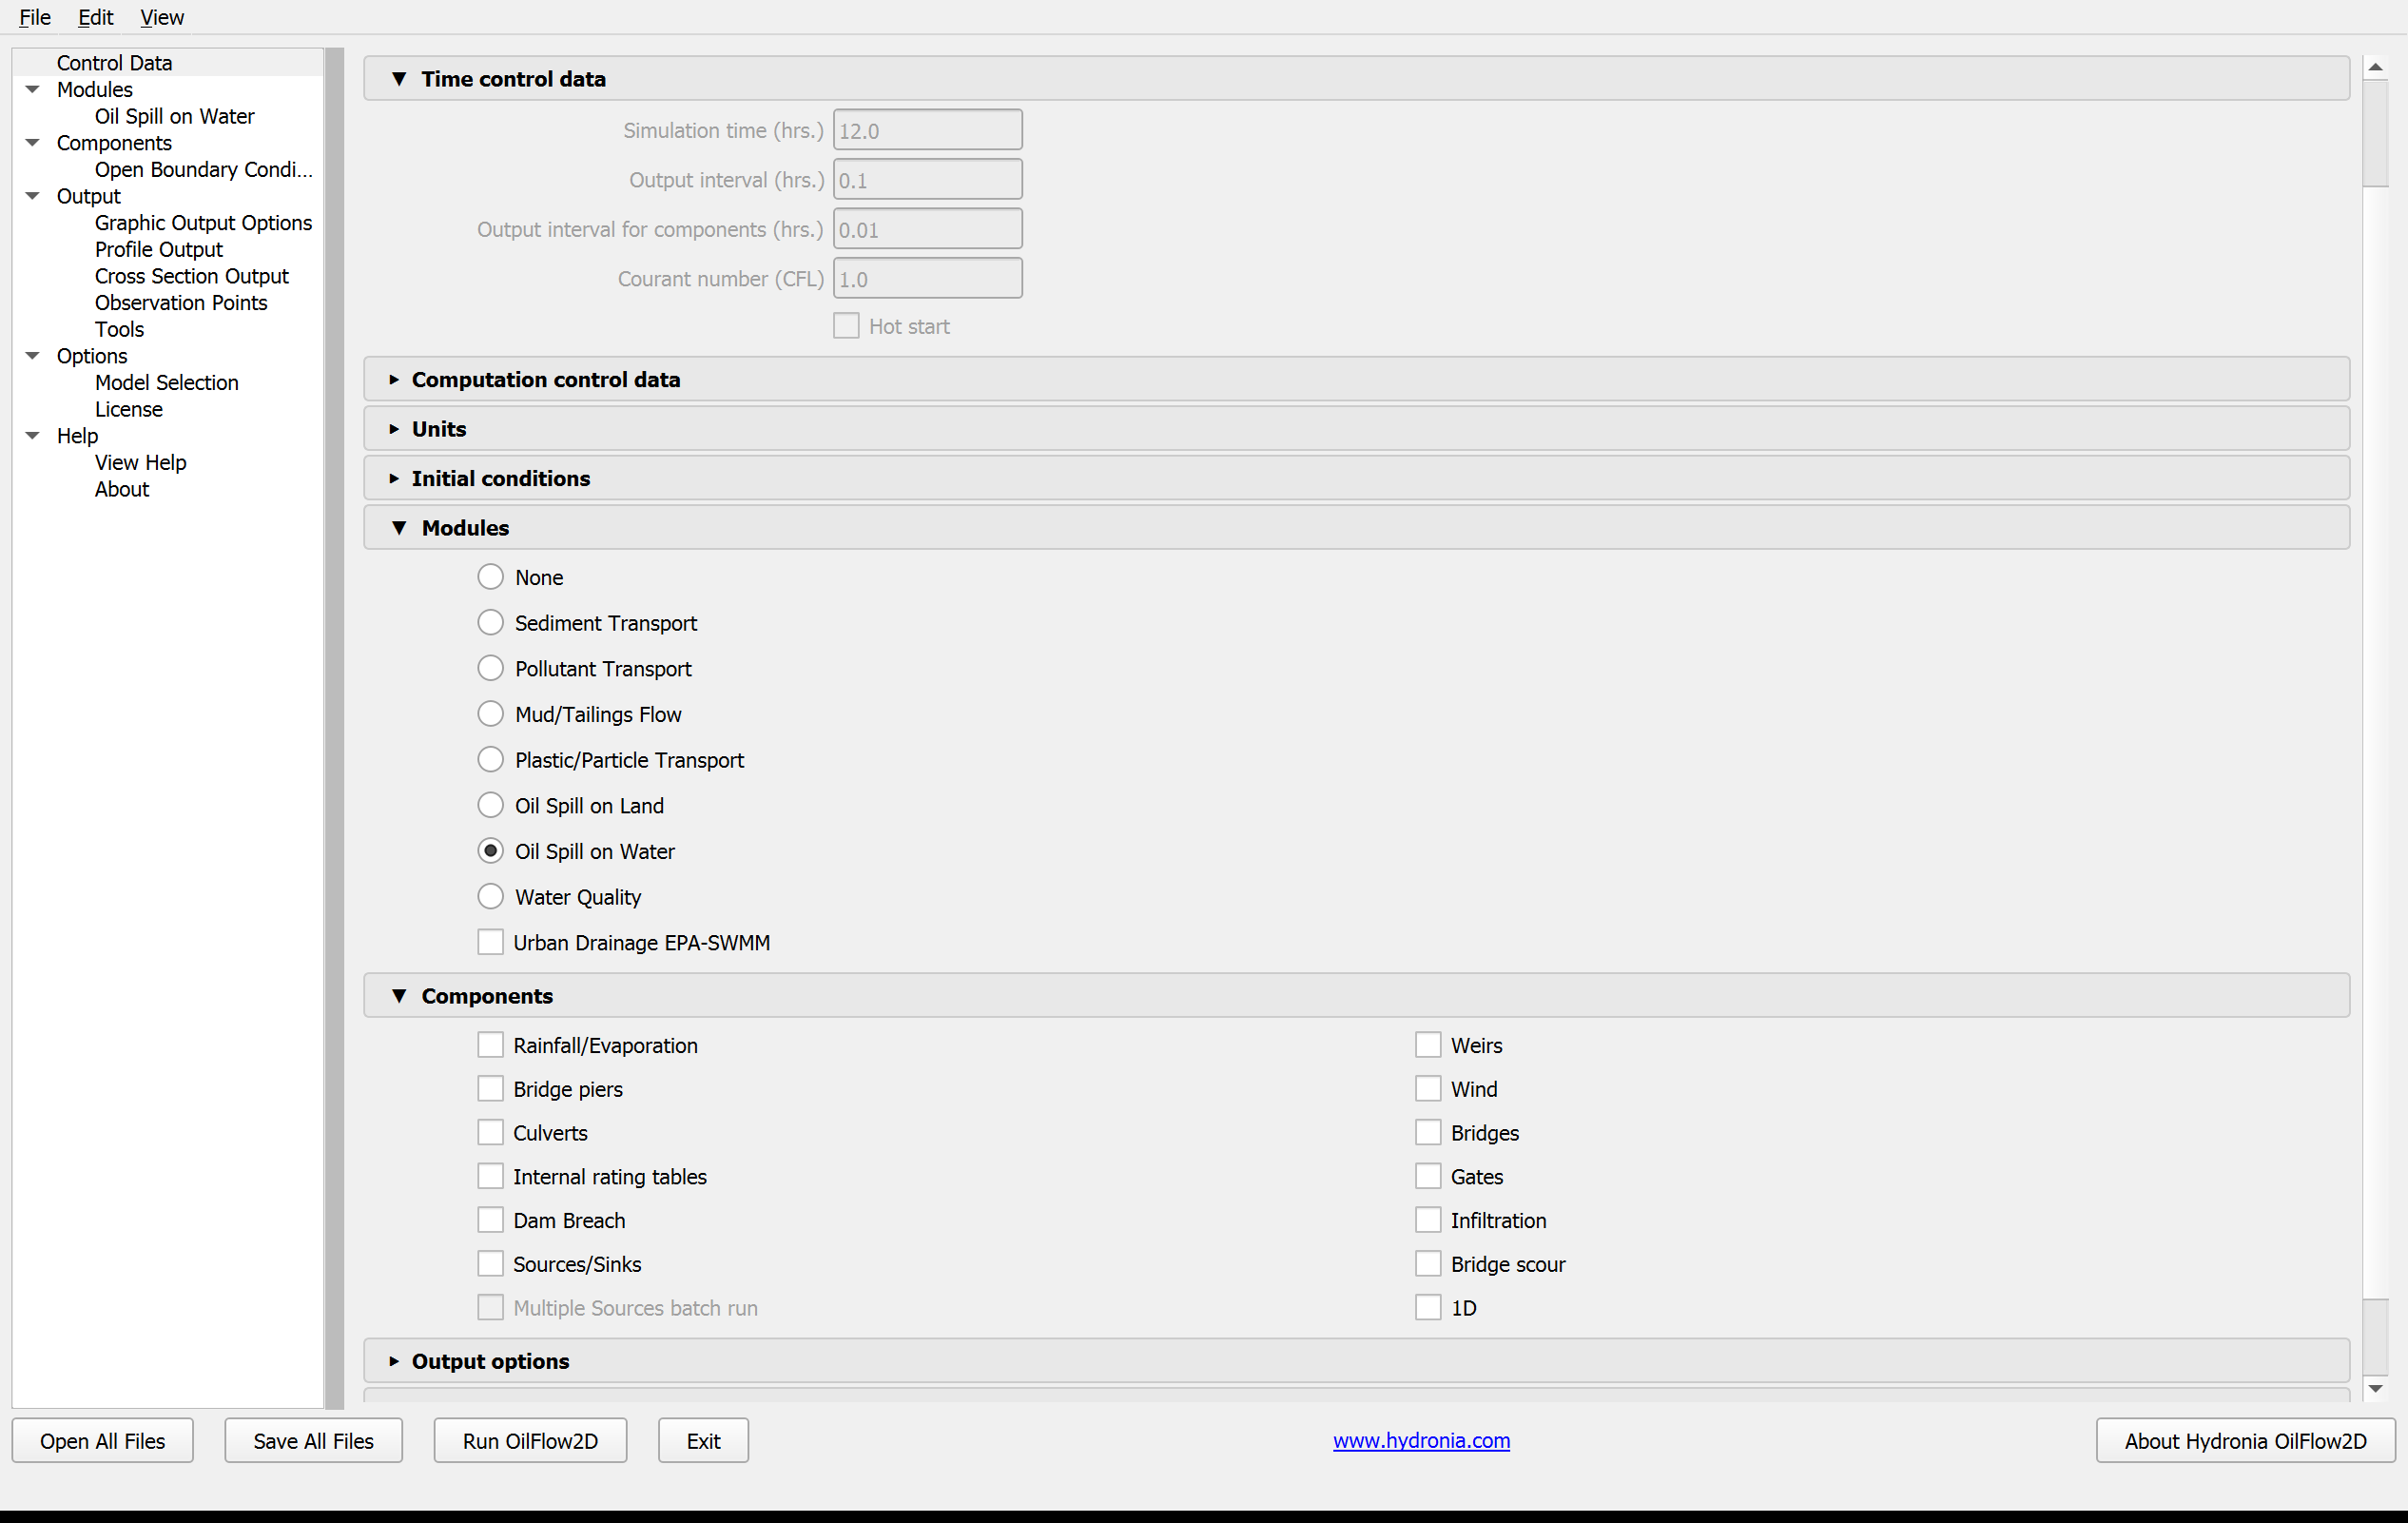
QGIS DIP and Classic DIP use the same project settings, but their interfaces look different. Older standalone or non-maintenance versions may open Classic DIP automatically. The project-specific Classic DIP settings and Run steps below are retained.
Enter additional data in the Hydronia Data Input Program and run OilFlow2D
-
Review the data in the Hydronia Data Input Program panels:
The following Classic DIP Control Data panel is retained as a legacy values reference:
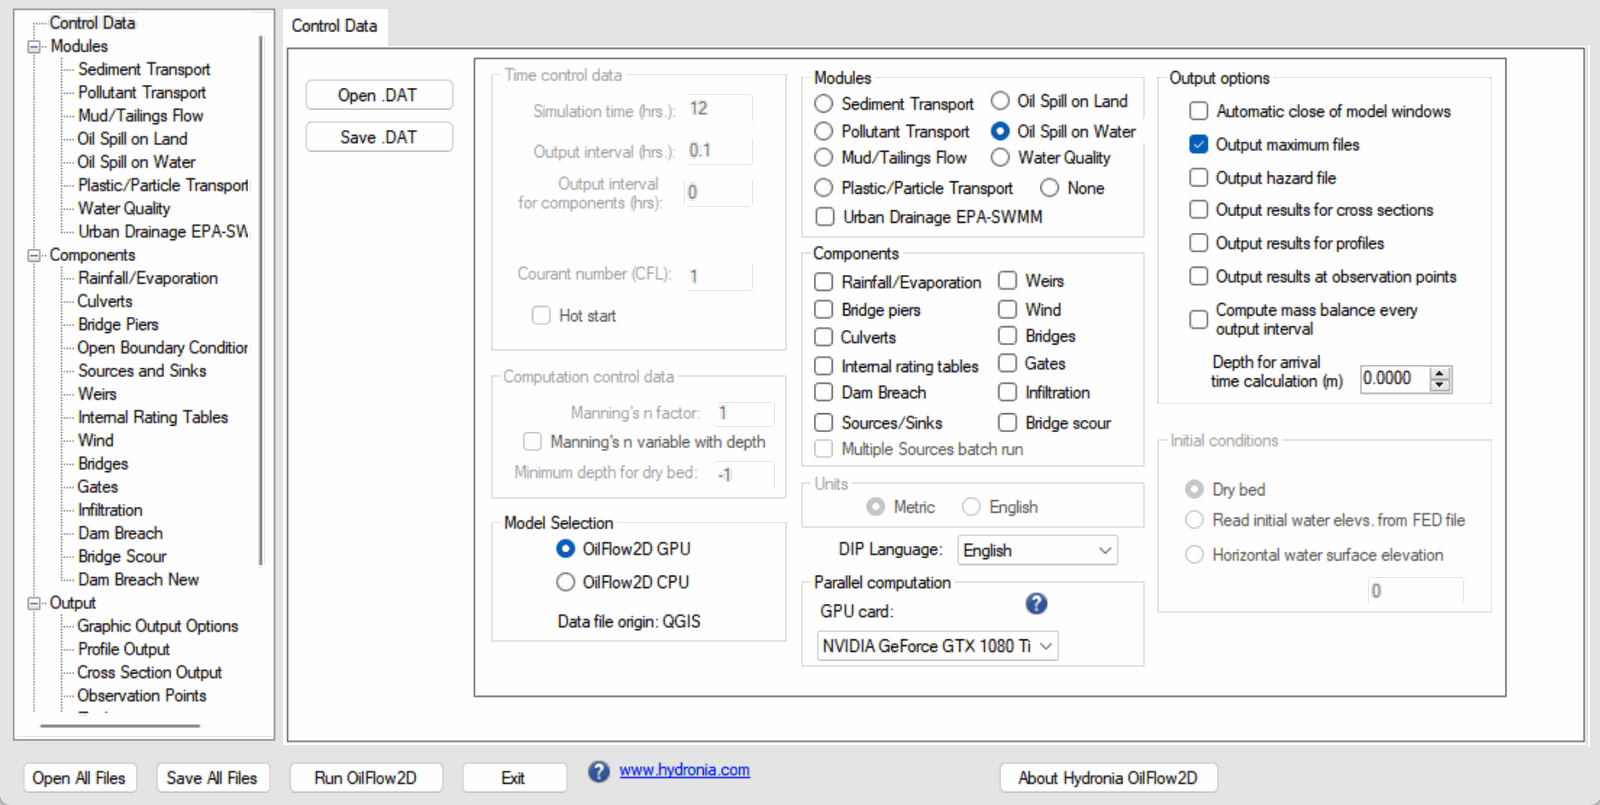
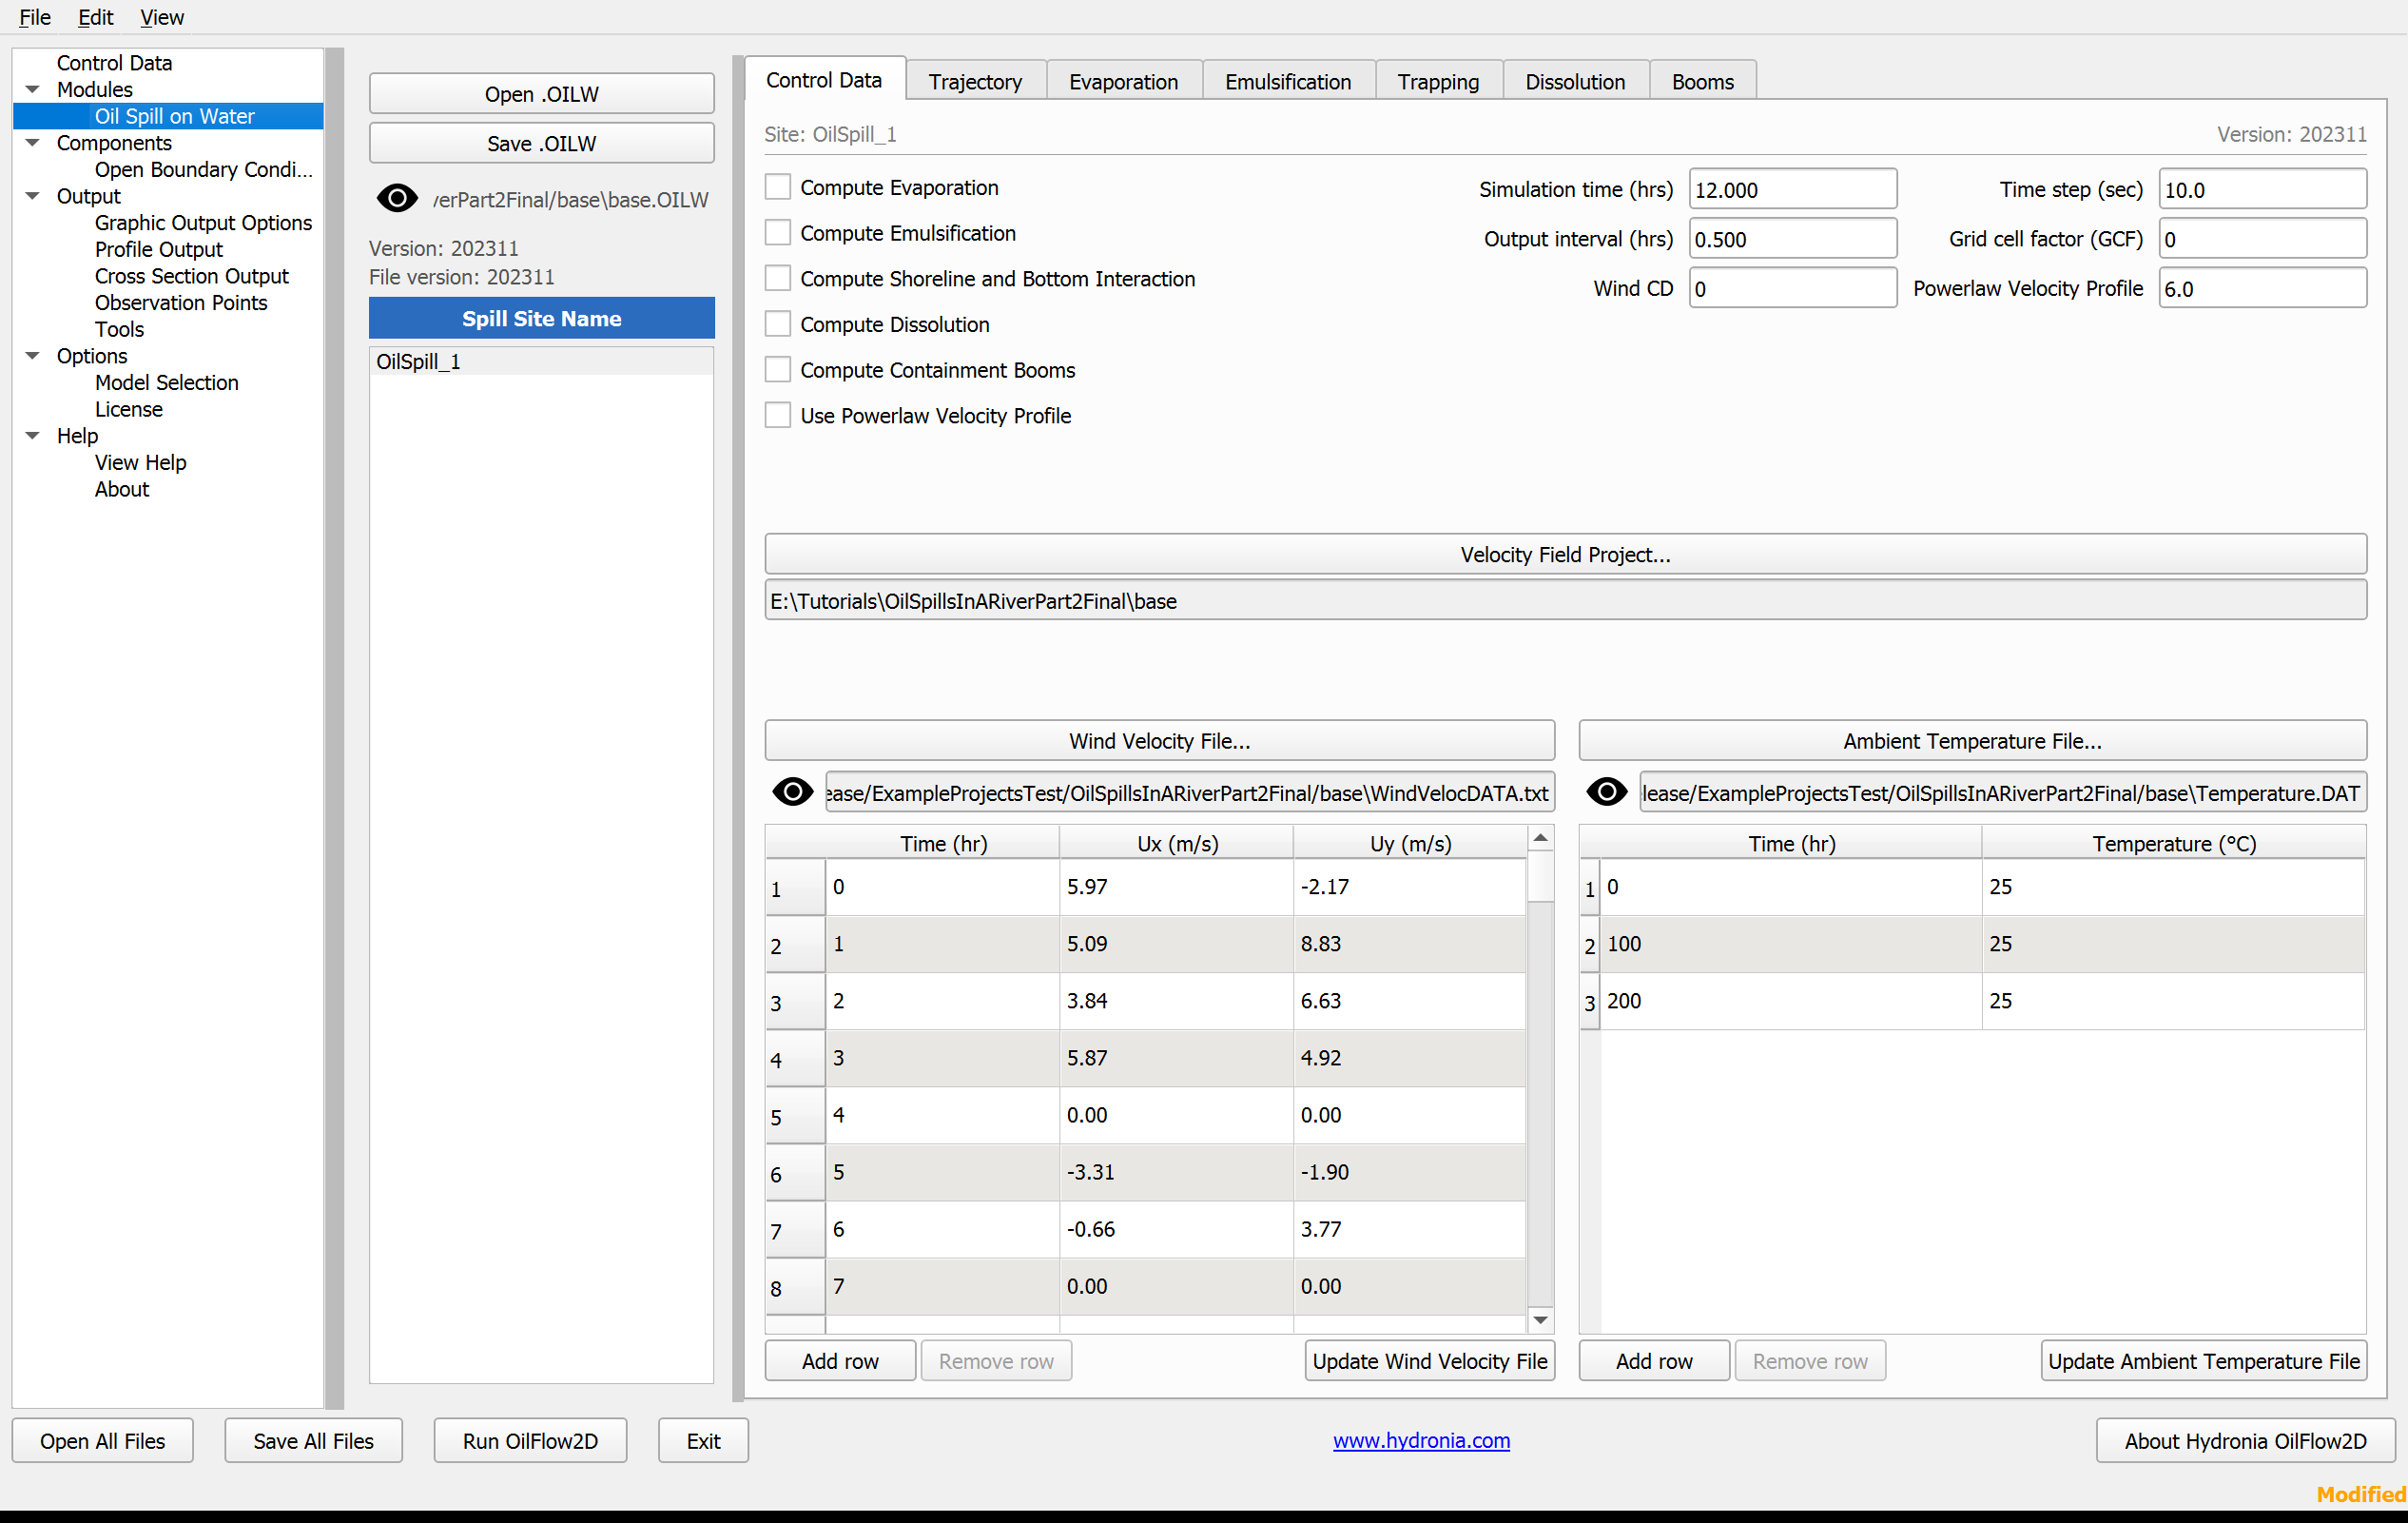
The following Classic DIP Oil Spill on Water Control Data panel is retained as a legacy values reference:
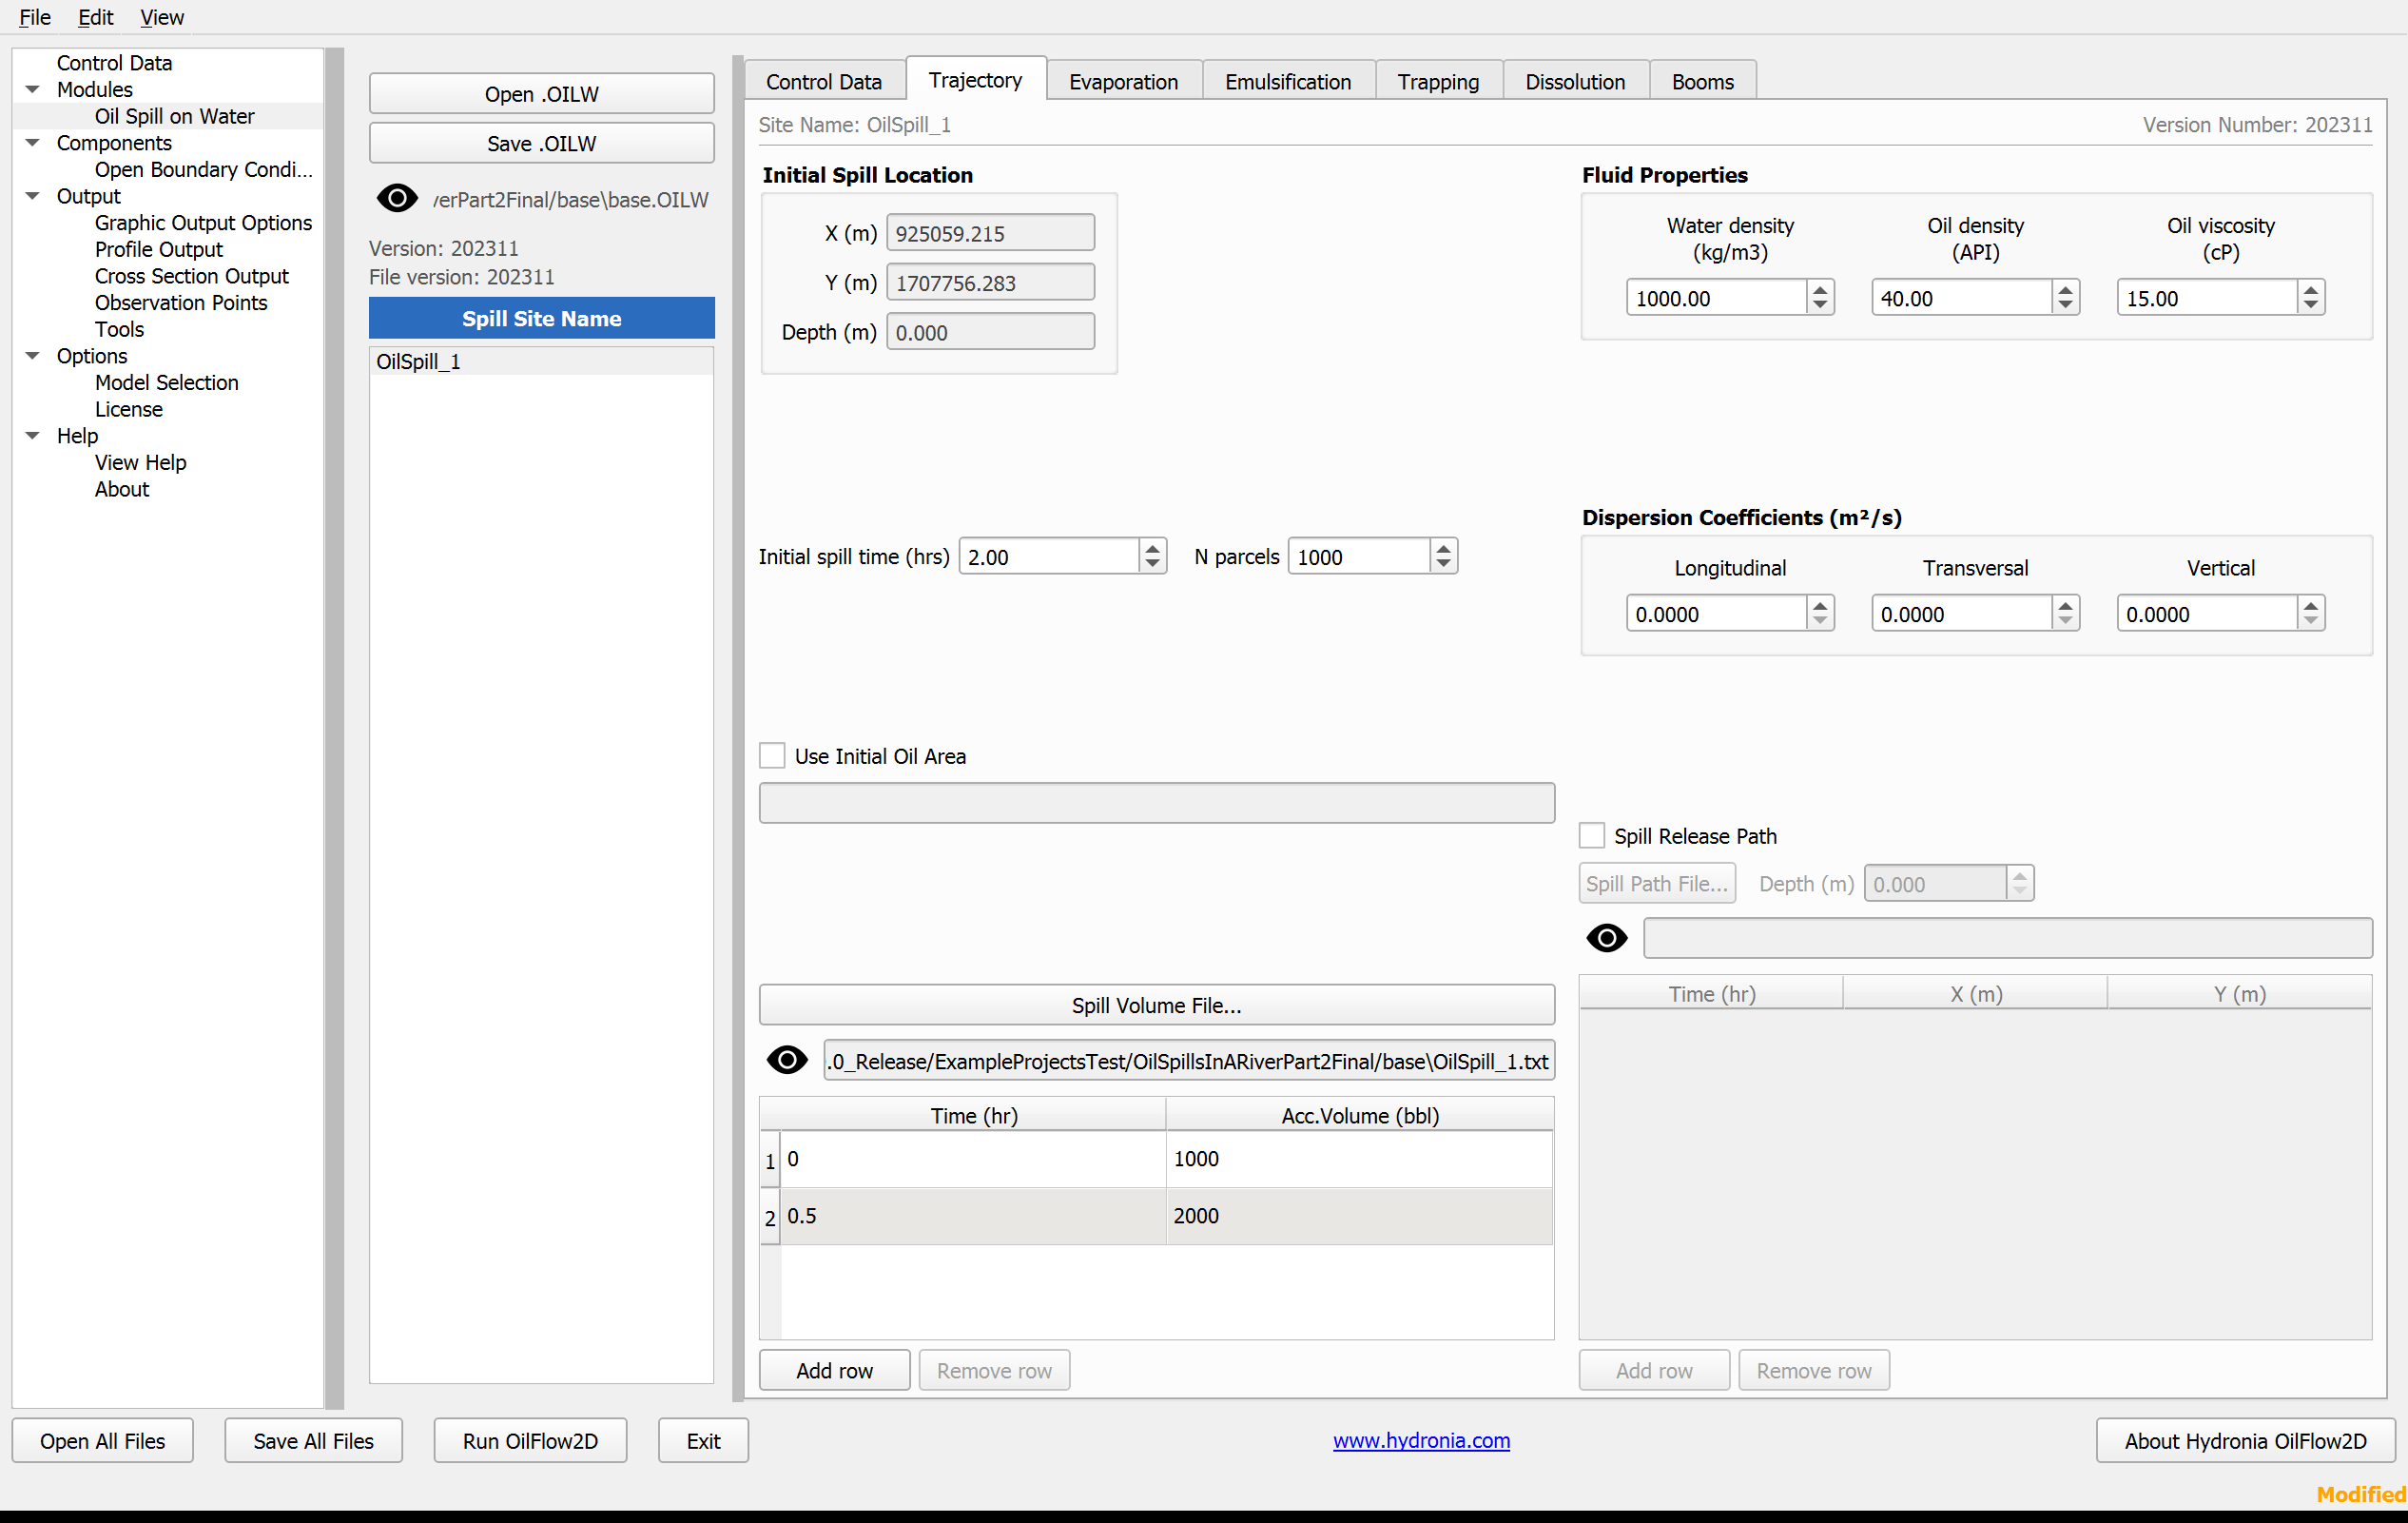
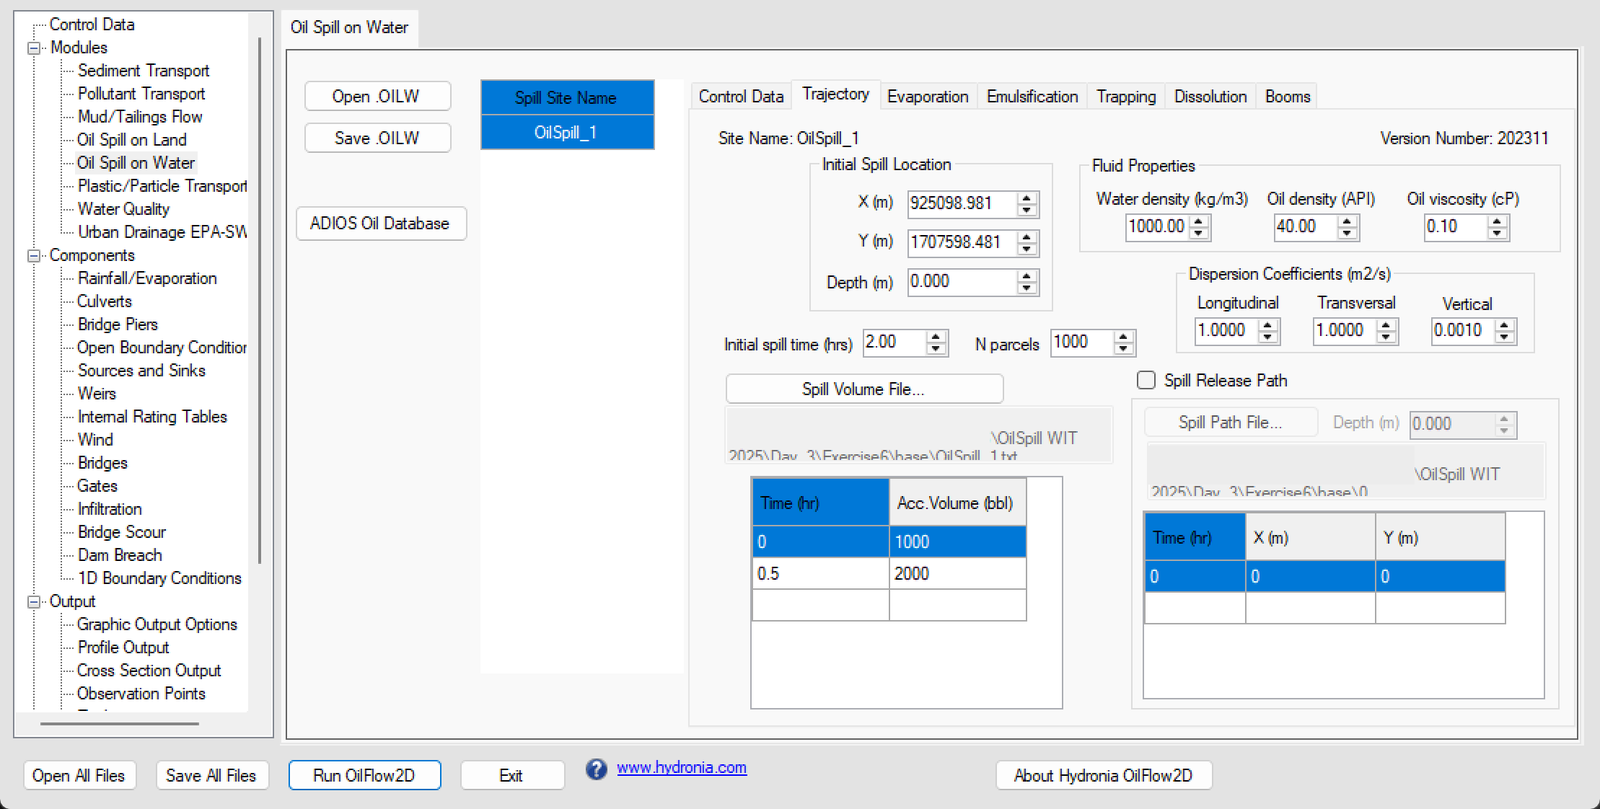
The following Classic DIP Oil Spill on Water Trajectory panel is retained as a legacy values reference:
-
Set the Logitudinal, Transversal and Vertical dispersion values to 0.
-
Click [Save .OILW] and overwrite the 'base.OILW' file.
-
When ready to run the model click Run OilFlow2D.
-
A plot window will open while the model runs:
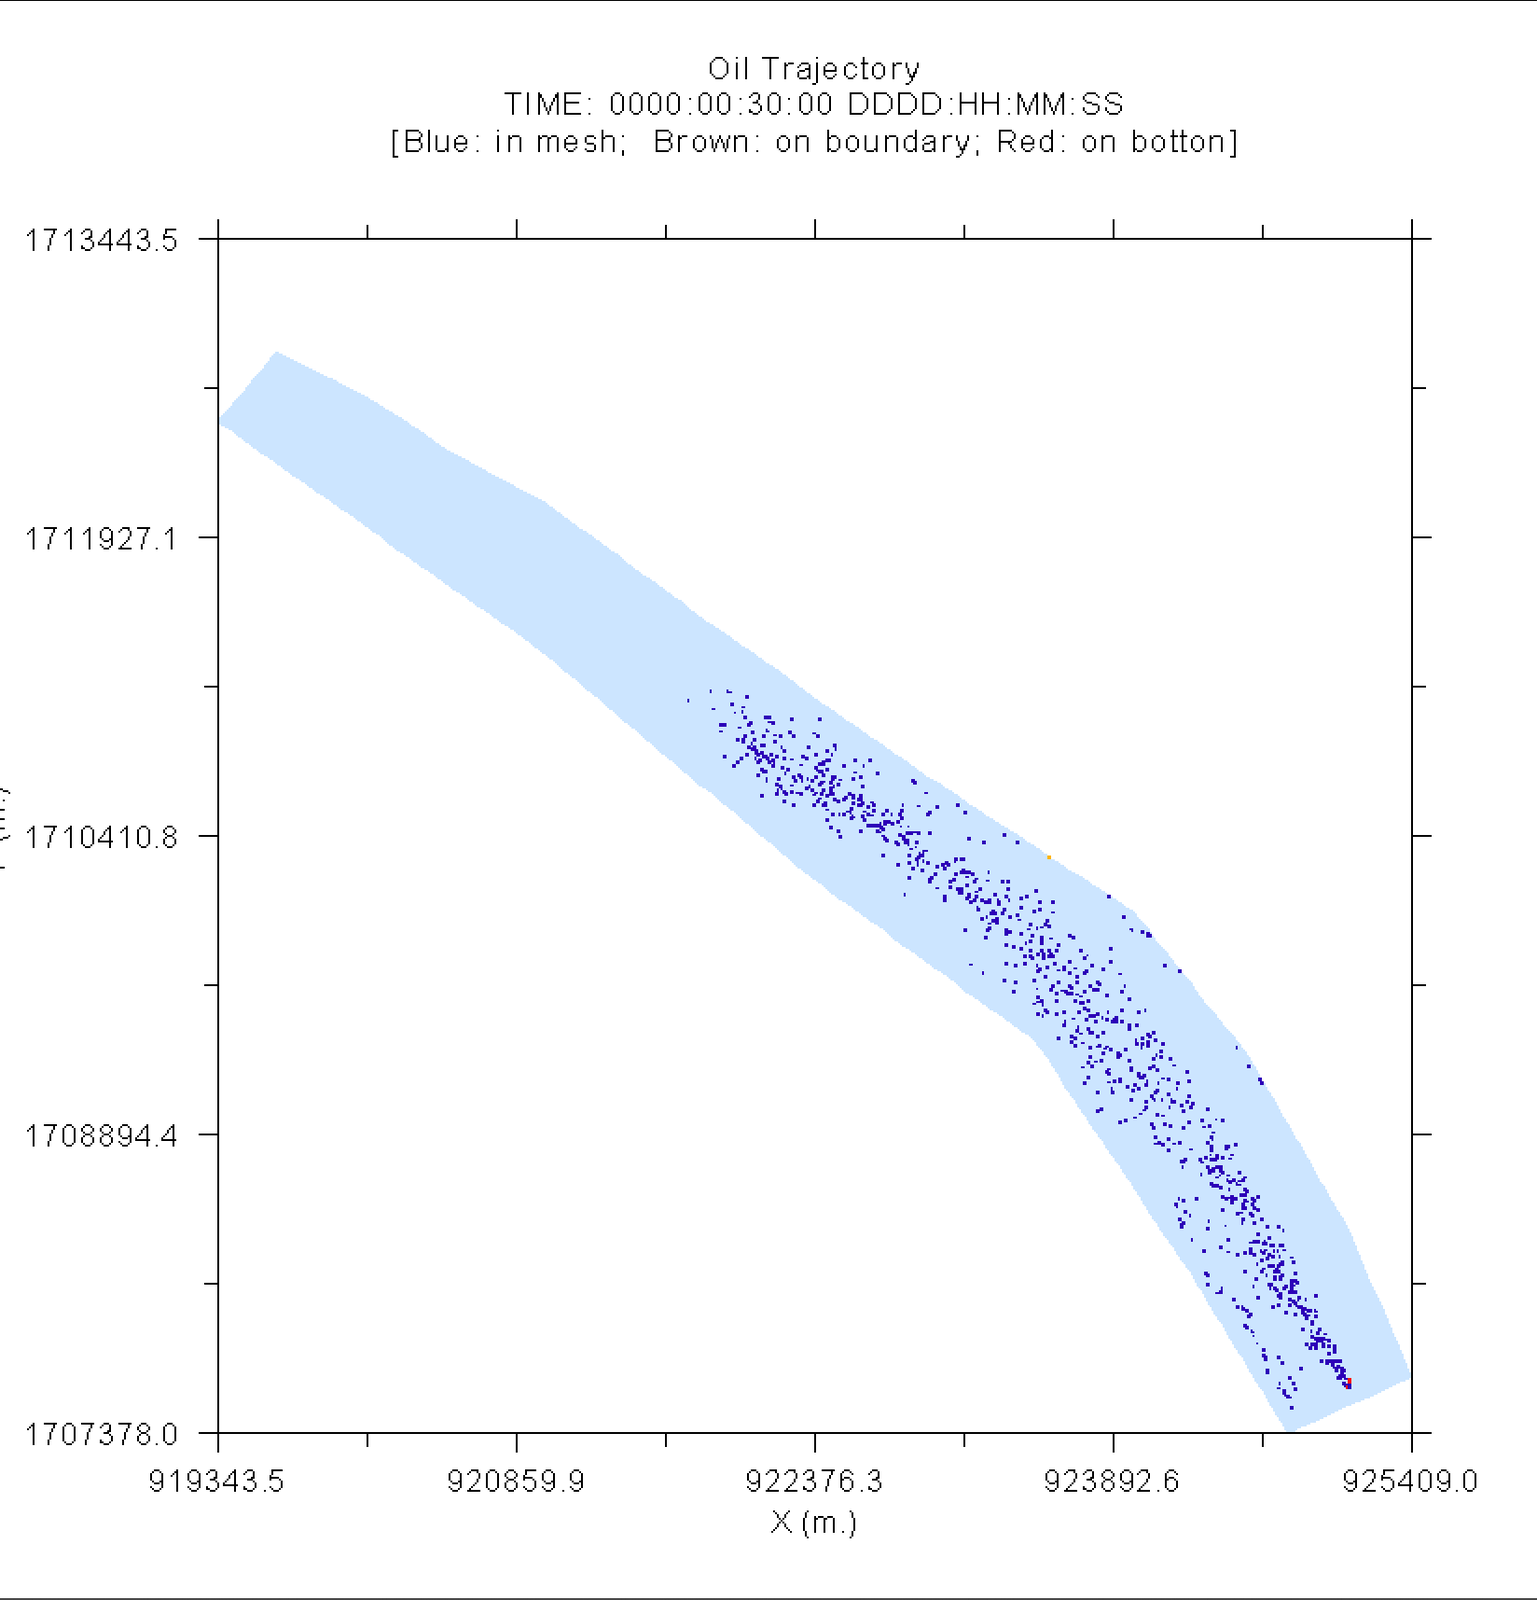
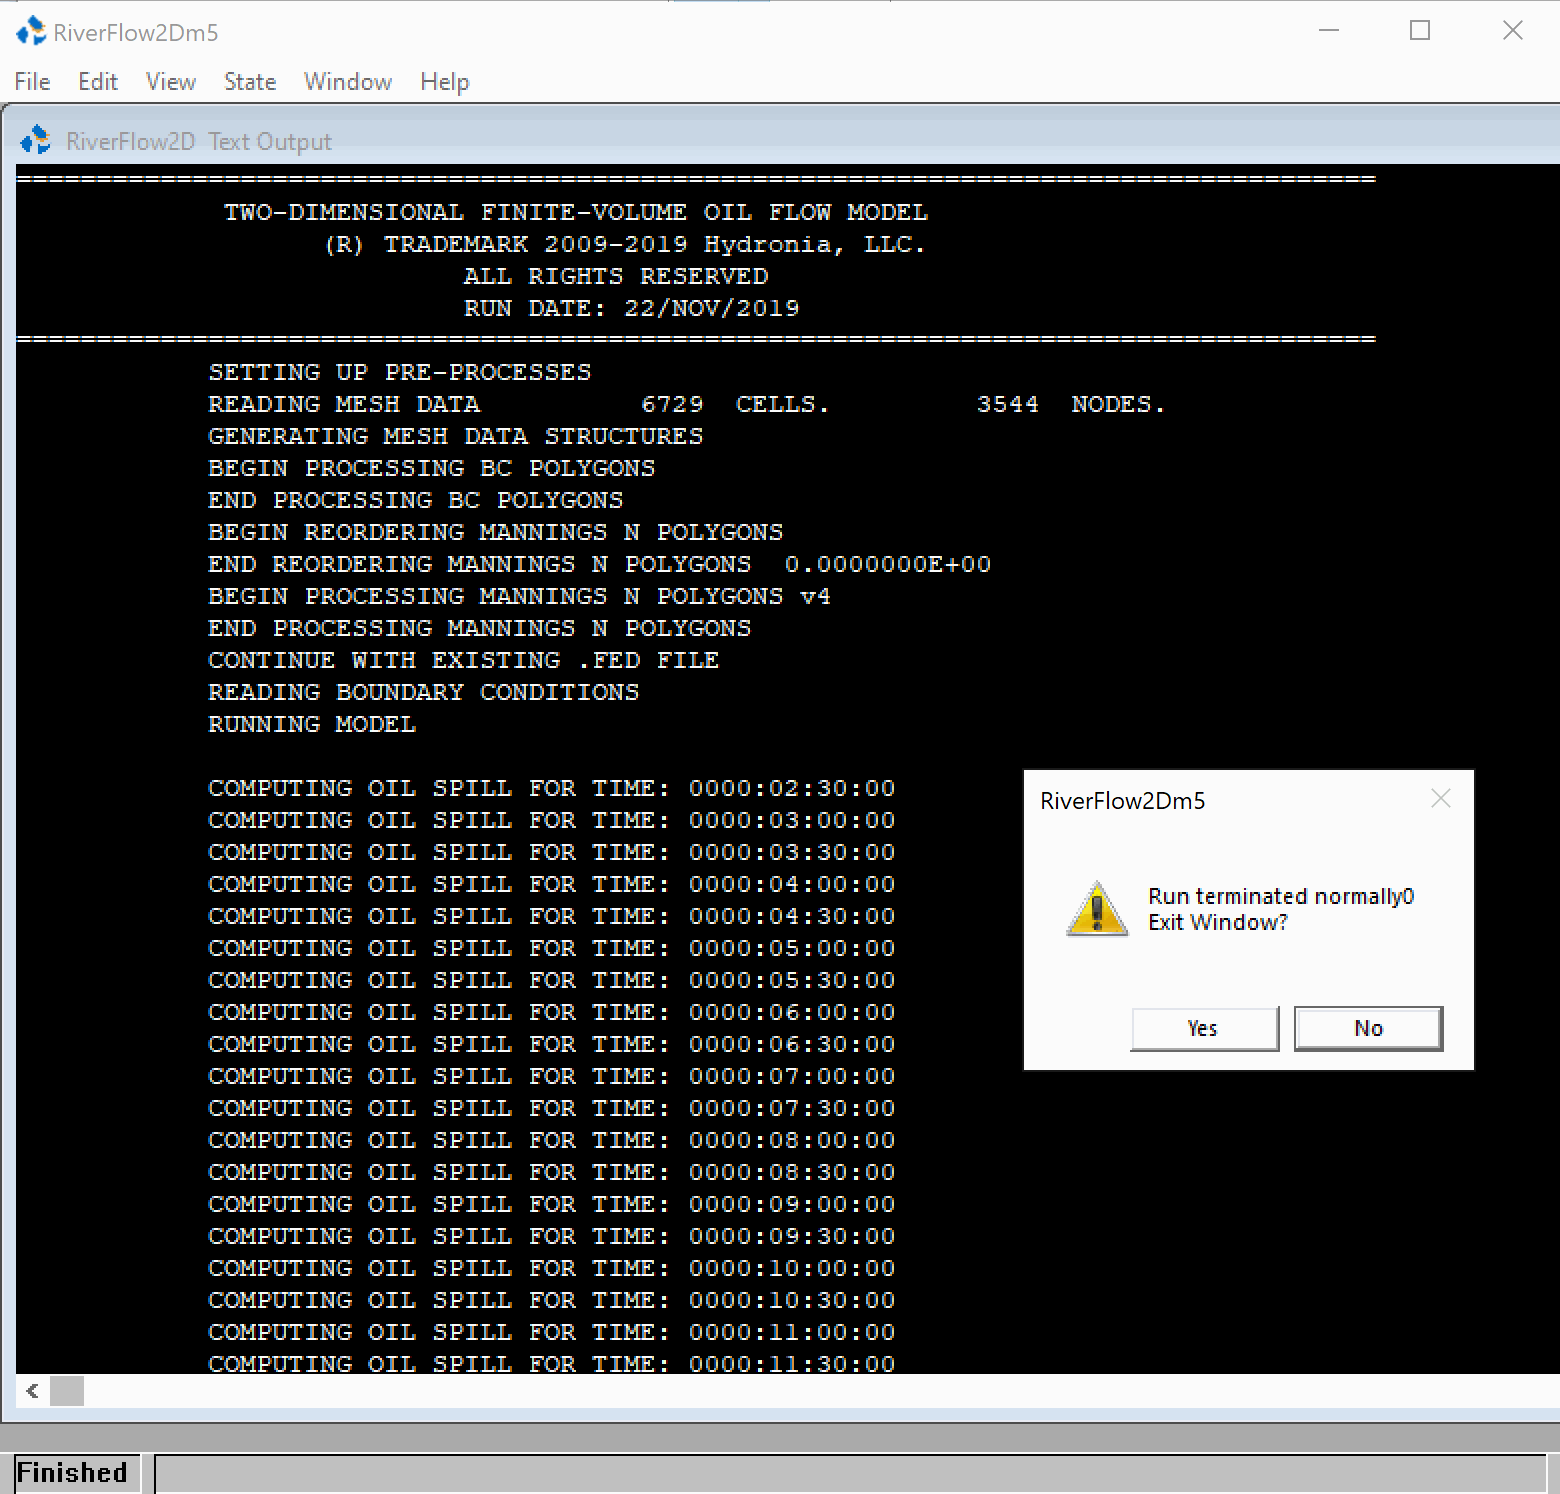
The model run window will report the times being computed and a message will indicate that the model finished running:
-
Click Yes to close the window.
Creating a Oil Spill Trajectory Animation
To check the model results we can create a oil trajectory animation using the following procedure:
-
Select the Animation tool
 :
: -
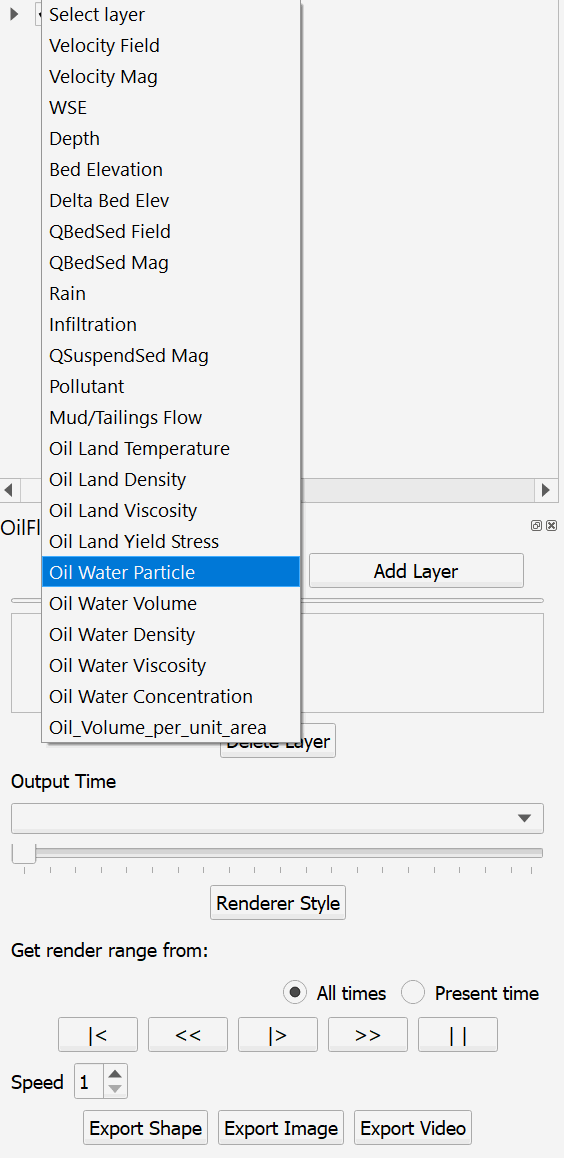
On the Animation panel, click Add Layer, and select the 'Oil Water Particles' from the dropdown menu as shown:
-
Click the Add Layer button, and select Oilspill_1 and click [OK].
-
Then on the Animation panel, select the Oil_Water_Particle_Oilspill_01 layer and click
 to view the animation: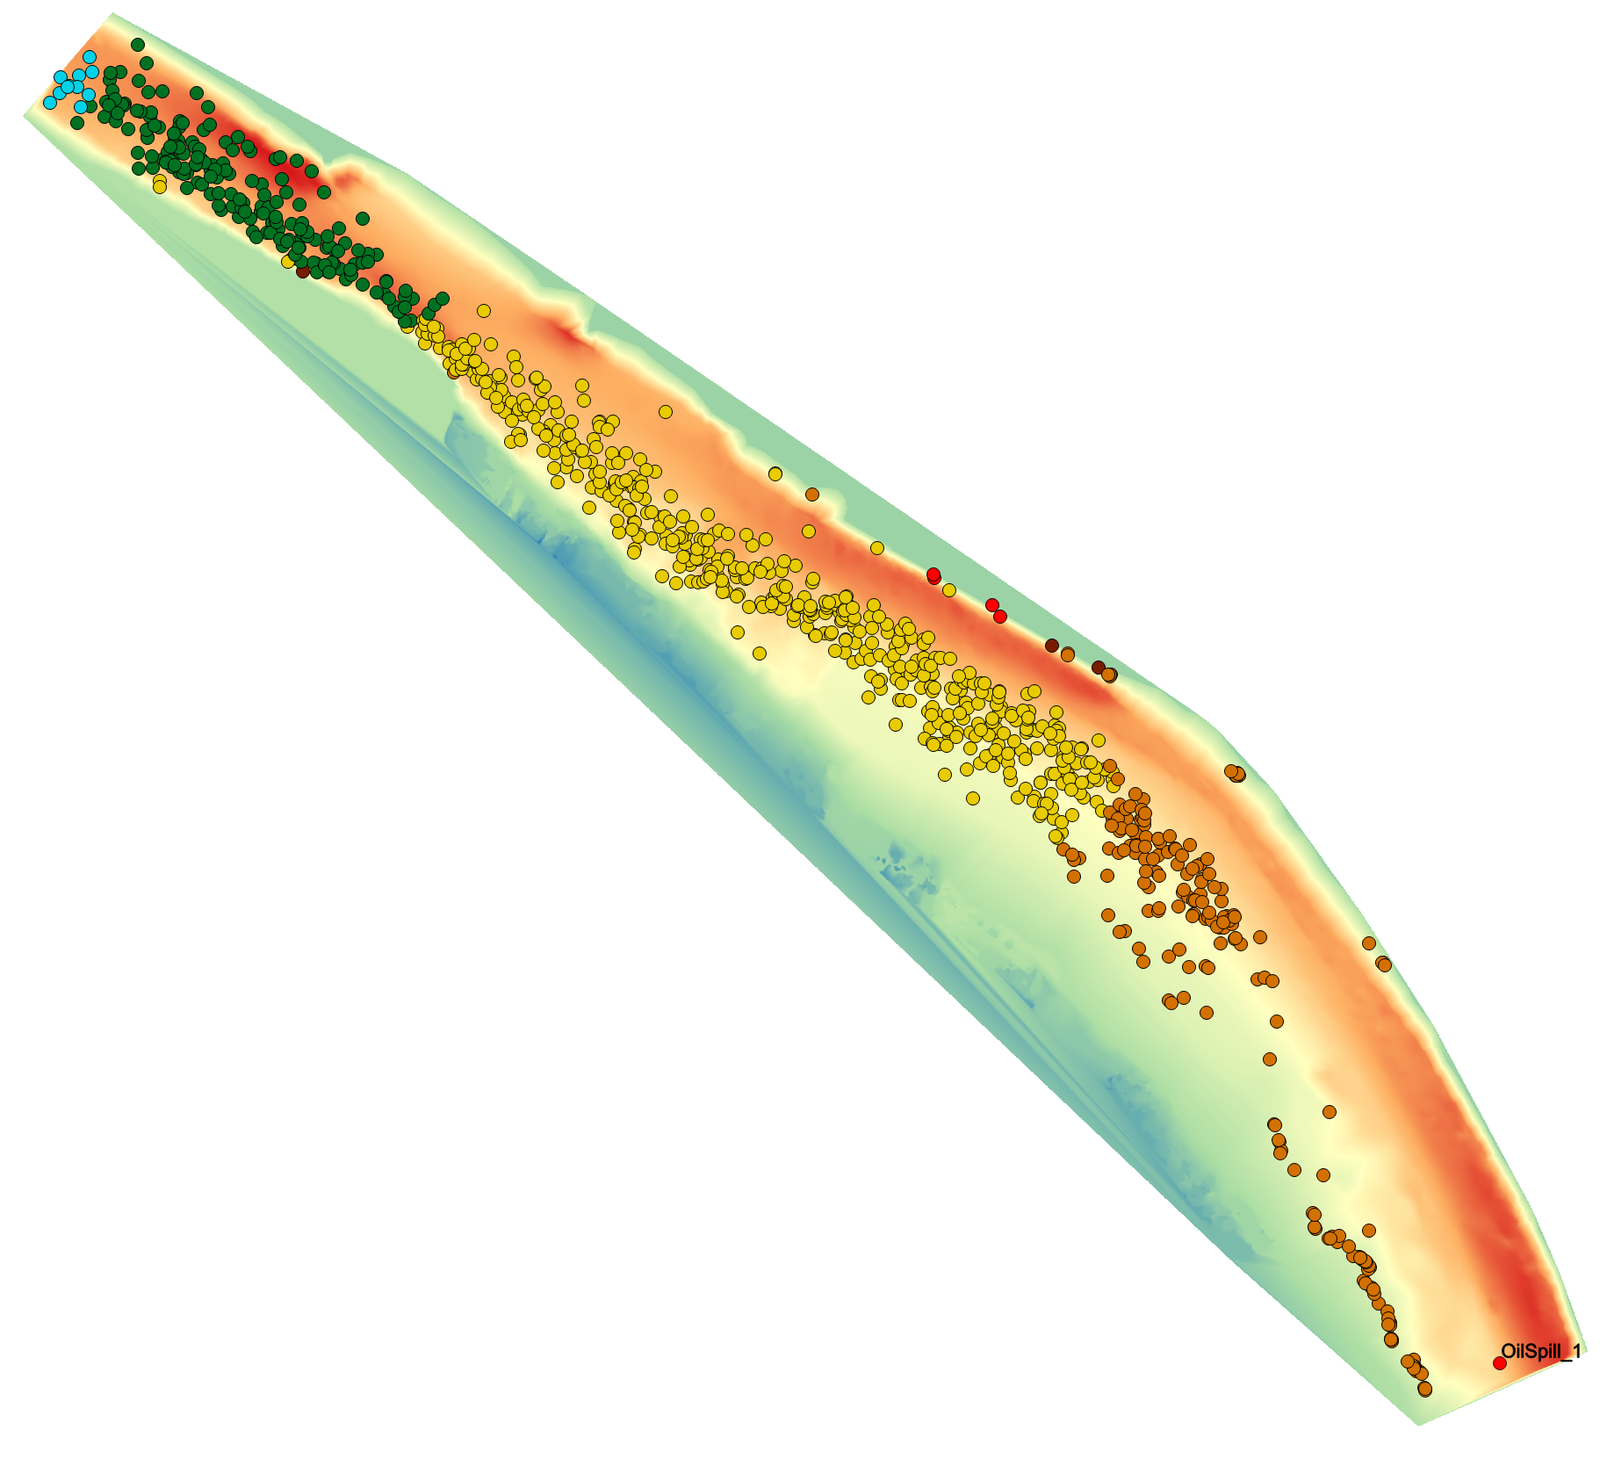
This concludes the tutorial Oil spills in Rivers. Part II: Oil Spill.